Discovering critical render-blocking resources and repairing them can significantly boost your SEO. Read on to learn how.
Render-blocking resources are a critical part of optimizing the infrastructure of your webpage.
Reducing them can help make your page load much faster and significantly improve your page’s Core Web Vitals.
These render-blocking resources include things like external fonts that take too long to load (that don’t need to be used), unnecessary media files, code bloat that just won’t go away, and additional plug-ins that aren’t necessary.
There is a myriad of these types of resources that you can compress and combine to create single files that download faster on your devices, creating a much faster page speed.
By optimizing your page structure in this matter, you can reduce the amount of work that Google has to do to crawl your site, and you can improve your user experience as a result.
In fact, the full benefits of doing this process include:
Clearly, there are tremendous benefits to performing this type of optimization process on your site.
Identifying and reducing resources responsible for blocking the rendering of your webpage is a critical optimization point that can make or break your page speed.
It can be so critical that it can pay dividends to your site’s page experience metrics (and your user’s satisfaction) as a result.
In 2021, the average time it took to fully render a mobile webpage was 22 seconds. In 2018, it was 15 seconds.
Clearly, this is a substantially higher number than Google’s recommended time of two to three seconds. It’s also substantially higher than it used to be.
What could be causing these issues with render-blocking resources?
What is driving this increase in overall page render speed?
One interesting trend to note is that there has been an increasing reliance on third-party fonts compared to system fonts. Using third-party fonts as a resource tends to interfere with the processing and rendering of a page.
With system fonts, the browser does not have to load anything extra, so it doesn’t have that additional processing step as a result.
This reliance across industries is likely to impact this rendering time. Of course, this is not the only cause of this issue with render-blocking resources.
In addition, Google’s own services tend to have a significant impact on rendering time, such as Google Analytics or using a third-party Facebook pixel for tracking purposes.
The desire to rely on such technologies is not necessarily terrible from a marketing perspective.
But from a render-blocking resources perspective, it can cause significant increases in page load time and how Google (and users) perceive your page.
The ideal solution is to ensure your page loads for user interaction as quickly as possible.
It’s also a possibility that poor web development practices in use by web developers today are to blame.
Either way, this is something in every website project that should be addressed as part of your Core Web Vitals audits.
Page experience, however, is not just about how fast the entire page loads.
Instead, it’s more about the overall experience of the page as measured by Google’s page experience framework or Core Web Vitals.
This is why you want to work on improving and optimizing your page speed for the critical rendering path throughout the DOM or document object model.
The critical rendering path refers to all of the steps that it takes to render the entire page, from when the browser first begins receiving data to when it finally compiles the page at the final render.
This is a process that can take only several milliseconds if you optimize it right.
Optimizing for the critical rendering path means making sure that you optimize for the performance of rendering on many different devices.
This is accomplished by optimizing the critical rendering path to get to your first paint as quickly as possible.
Basically, you’re reducing the amount of time users spend looking at a blank white screen to display visual content ASAP (see 0.0s below).
There’s a whole process on how to do this, outlined in Google’s developer guide documentation, but I will be focusing on one heavy hitter in particular: reducing render-blocking resources.
The critical rendering path refers to the series of steps a browser takes on its journey to render a page by converting the HTML, CSS, and JavaScript to actual pixels on the screen.
Essentially, the browser needs to request, receive, and parse all HTML and CSS files (plus some additional work) before it will start to render any visual content.
This process occurs within a fraction of a second (in most cases). Users will see a blank white page until the browser completes these steps.
The following is an example of how users may experience how a page loads according to the different stages of the page load process:
Improving the critical rendering path can thus improve the overall page experience, which can help improve performance on Core Web Vitals metrics.
To improve the critical rendering path, you must analyze your render-blocking resources.
Any render-blocking resources may end up blocking the initial rendering of the page and negatively impact your Core Web Vitals scores as a result.
This involves an optimization process of:
By doing this, it’s possible to improve both Core Web Vitals and how your page physically renders to the user.
Before discussing optimization techniques you can use to optimize the critical rendering path, it’s important to discuss the initial browser loading process and why the critical rendering path is so important.
And this process involves:
First, when the page is fetched by the browser from the server, the browser will initially scan and find all page elements to be downloaded. By default, this happens in a process where the browser downloads all elements simultaneously.
But what happens when you have many page elements to download (such as what frequently happens with a WordPress website?) Well, this can bog down server resources, which further increases the page load time.
How do you get around this? By using the preload link to asynchronously download critical files that are blocking the rendering of the page (discussed later on in this article).
Preloading elements is a technique that helps eliminate render-blocking style sheets because it loads critical files needed for the first paint stage of the process before loading all of the other files.
You can preload CSS, JS, Fonts, or Images. Here are examples of how to preload them:
JavaScript Preloading
CSS Preloading
Fonts Preloading
Images Preload
This helps speed up the process of the page. However, this is not an ideal method.
The ideal method is to optimize the site to only use two to three plugins, maybe two to three other files, and keep things at their bare minimum for the full page rendering.
Sadly, this is not a realistic endeavor to pursue.
Because WordPress sites do tend to have many plugins and resources that developers just aren’t willing to (or want to) deal with, the easiest path to success is to work on making sure that these resources are properly optimized by using certain plugins.
Critical CSS is a technique that extracts the CSS for above-the-fold content to render content to the user as fast as possible.
At the minimum, this usually requires:
Using our earlier example of the page loading all resources simultaneously, inlining critical styles involve using code within the HTML <head> tag itself.
If you check, for example, google.com source code, you will see it inlined critical CSS into the <head> section of the HTML.
There are several tools that can help to extract critical CSS.
By using this method, it’s possible to defer the loading of JavaScript files until after other critical elements of the DOM tree are loaded. However, this comes with a few caveats.
Example of how to defer JavaScript file:
Number one is that you can negatively impact the site’s appearance when deferring the loading of JavaScript files because some of these could be required elements for the page to load completely.
Number two is, if you’re not careful, by deferring the loading of JavaScript files, you could potentially introduce issues with the page’s interactivity (interaction to next paint Core Web Vitals metric).
Number three is that you can also introduce problems with how the site works overall.
The idea is that you have to be careful when you’re working on these types of optimizations, so you don’t inadvertently cause issues elsewhere in the process.
By doing so, you can greatly impact your page speed and how Google sees your site.
The other concern, however, is when you use plugins such as Nitro to defer critical files like CSS and JavaScript.
While this can have a positive impact on page speed, the major issue with this is that the plugin defers all CRITICAL files until after the page has loaded the HTML portion of the document.
What does this mean? This means that Google cannot see the entire document as it is intended to display. This is similar to blocking your CSS files and JavaScript files using robots.txt, which Google does need to determine whether your site is mobile-friendly.
The official Google Developer page says this, as mentioned elsewhere:
“For optimal rendering and indexing, always allow Googlebot access to the JavaScript, CSS, and image files used by your website so that Googlebot can see your site like an average user.
If your site’s robots.txt file disallows crawling of these assets, it directly harms how well our algorithms render and index your content. This can result in suboptimal rankings.”
If you are deferring critical CSS and JavaScript files for SEO reasons, so long as you ensure that Google can see these files on page load, you should not run into any major issues with how Google can see your site.
Before we can talk about early hints, we need to discuss the process of how the server loads a webpage. Sites have indeed become more sophisticated in recent years.
And thus, so have servers. But, there are limitations. Even though servers can and do perform trivial tasks all day long, it’s still possible for a server to become bogged down by working to overthink how it handles a site’s resources.
So, when this happens, additional latency than otherwise would be experienced occurs – and this happens before the browser can start rendering the page.
When this latency occurs, you can run into situations where a site could take a couple of seconds before appearing in the browser window.
And making sure your server renders the files properly is an excellent first step toward increasing your page speed.
Here’s an example of what happens when your server does not properly respond and takes too long to process certain resources:
So, how do early hints work?
According to the Google Chrome Developer guide, “early hints are an HTTP status code (103 Early Hints) which is used to send an accurate preliminary HTTP response ahead of a final response.”
What does this accomplish?
This lets a server provide certain types of hints to a browser for certain critical resources (JavaScript files, CSS style sheets, and more) that are likely to be loaded and used by the web page itself.
This process happens in the span of a few milliseconds or less while the server works on rendering the main page resources.
Early Hints are something that “helps a browser along” and expedites server thinking time by working on this loading in advance.
Because of this, this process helps speed up page load time as a result.
Are you not a code master extraordinaire, and you’re unable to work with and optimize code, plugins, and things underneath your website’s hood?
Well, never fear (too much!). There are WordPress plugins available that can help you do just that.
The following includes a list of tools that you can use to help optimize your own critical rendering path for success:
Please note: This author has no financial bias with any of these tools.
Google’s user behavior data reports that most users abandon a slow site after about three seconds.
In addition to studies that show that reducing page load time and improving the page experience leads to greater user satisfaction, there are also several major Google updates on the horizon that you will want to prepare for.
Identifying and optimizing render-blocking resources will be critical to staying on top of the game when these updates hit.
Google will be implementing page experience on the desktop in 2022, beginning their rollout of desktop page experience in February and finishing up in March.
According to Google, the same three Core Web Vitals metrics (LCP, FID, and CLS), along with their associated thresholds, will now be linked to desktop ranking.
Also, Google is working on a brand-new, possibly experimental Core Web Vitals metric, taking into account maximum event duration and total event duration.
Their explanation of these factors they are considering are:
Maximum event duration: the interaction latency is equal to the largest single event duration from any event in the interaction group.
Total event duration: the interaction latency is the sum of all event durations, ignoring any overlap.
With many studies linking reductions in page load times to improvements in valuable KPIs (conversions, bounce rate, time on site), improving site latency has become a top-of-mind business goal for many organizations.
SEO professionals are uniquely positioned to guide this effort, as our role is often to bridge the gap between business goals and web developers’ priorities.
Having the ability to audit a site, analyze results, and identify areas for improvement helps us to work with developers to improve performance and translate results to key stakeholders.
One of the primary goals of optimizing the critical rendering path is to make sure that the resources that are needed to render that important, above-the-fold content are loaded as quickly as is humanly possible.
Any render-blocking resources must be deprioritized, and any resources that are preventing the page from rendering quickly.
Each optimization point will contribute to the overall improvement of your page speed, page experience, and Core Web Vitals scores.
Google has said many times that coding is not necessarily important for ranking.
But, by the same token, gaining a ranking benefit from page speed optimization improvements can potentially help, depending on the query.
When it comes to CSS files, they are considered to be render-blocking resources.
Why is this?
Even though it happens within a millisecond or less (in most cases), the browser won’t start to render any page content until it can request, receive, and handle all CSS styles.
If a browser renders content that’s not styled properly, all you would get is a bunch of ordinary text and links that are not even styled.
This means that your page will basically be “naked,” for lack of a better term.
Removing the CSS styles will result in a page that is literally unusable.
The majority of content will need repainting in order to look the least bit palatable for a user.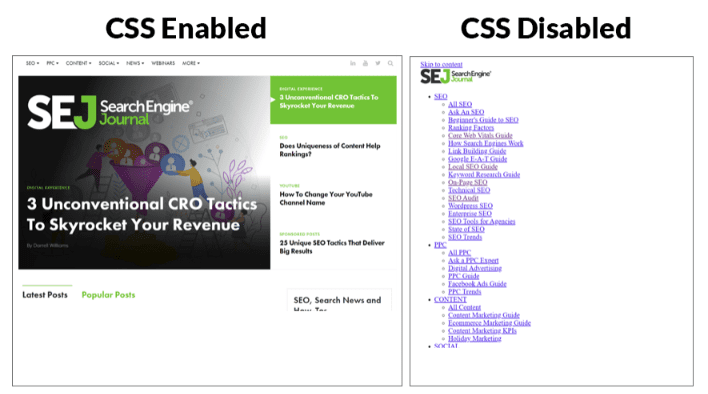
If we examine the page rendering process, the gray box below represents the browser time needed to get all CSS resources. This way, it can begin constructing the DOM of CSS (or CCSOM tree).
This could take anywhere from a millisecond to several seconds, depending on what your server needs to do to load these resources.
It can also vary, which could depend on the size, along with the quantity, of these CSS files.
The following render tree shows an example of a browser rendering all the files along with CSS within the DOM:
In addition, the following shows an example of the rendering sequence of a page, in which all the files load in a process, from the construction of the DOM to the final painting and compositing of the page, which is known as the critical rendering path.
Because CSS is a render-blocking resource by default, it makes sense to improve CSS to the point where it doesn’t negatively impact the page rendering process.
The official Google recommendation states the following:
“CSS is a render-blocking resource. Get it to the client as soon and as quickly as possible to optimize the time to first render.”
The HTML must be converted into something the browser can work with: the DOM. CSS files are the same way. This must be converted into the CSSOM.
By optimizing the CSS files within the DOM and CSSOM, you can help decrease the time it takes for a browser to render everything, which greatly contributes to an enhanced page experience.
Did you know that loading JavaScript is not always required?
With JavaScript, downloading and parsing all JavaScript resources is not a necessary step for fully rendering a page.
So, this isn’t really a technically required part of page render.
But the caveat to this is: Most modern sites are coded in such a way that JavaScript (for example, the Bootstrap JS framework) is required in order to render the above-the-fold experience.
But if a browser finds JavaScript files before the first render of a page, the rendering process can be stopped until later and after JavaScript files are fully executed.
This can be specified otherwise by deferring JavaScript files for later use.
One example of this is if there are JS functions like an alert that’s built into the HTML. This could stop page rendering until after the execution of this JavaScript code.
JavaScript has the sole power to modify both HTML and CSS styles, so this makes sense.
Parsing and execution of JavaScript could be delayed because of the fact that JavaScript can potentially change the entire page content. This delay is built into the browser by default – for just such a “just in case” scenario.
Official Google recommendation:
“JavaScript can also block DOM construction and delay when the page is rendered. To deliver optimal performance … eliminate any unnecessary JavaScript from the critical rendering path.”
To identify the critical rendering path and analyze critical resources:
Analyze your waterfall view; look for CSS or JavaScript files that are requested before the green “start render” line but are not critical for loading above-the-fold content.
After identifying a (potentially) render-blocking resource, test removing it to see if above-the-fold content is affected.
In my example, I noticed some JavaScript requests that may be critical.
Even though they are critical, it’s sometimes a good idea to test removing these scripts to test how shifting elements on the site affect the experience.
There are also other ways to improve such resources.
For non-critical JavaScript files, you may want to look into combining the files and deferring them by including these files at the bottom of your page.
For non-critical CSS files, you can also reduce how many CSS files you have by combining them into one file and compressing them.
Improving your coding techniques can also result in a file that’s faster to download and causes less impact on the rendering speed of your page.
Once you determine that a render-blocking resource is not critical for rendering content above the fold, you will want to explore a myriad of methods that are available in order to improve the rendering of your page and defer non-critical resources.
There are many solutions to this problem, from deferring JavaScript and CSS files to reducing the impact that CSS can have.
One possible solution is to not add CSS using the @import rule.
From a performance perspective, even though @import appears to keep your HTML file cleaner, it can actually create issues with performance.
The @import declaration will actually cause the browser to process a CSS file more slowly. Why? Because it is also downloading all of the imported files.
Rendering will be entirely blocked until the process completes.
Indeed, the best solution is to use the standard method of including a CSS stylesheet using the <link rel=”stylesheet”> declaration in the HTML.
If you are on WordPress, using a plugin to minify your CSS and JavaScript files can have a tremendous impact.
The process of minification takes all of the unnecessary spaces within a file and compresses it even further, so you can end up with a nice performance boost.
Also, even if you are not on WordPress, you can use the services of a well-qualified developer to complete the process manually.
This will take more time but can be well worth it.
Minified files are usually much lighter than their former counterparts, which means that initial rendering will complete much faster.
In addition to this, after the minification process, you can also expect the download process to be faster because less time is necessary to download non-render blocking resources.
While third-party fonts may appear to make a site “prettier,” this is not exactly the case.
While it may look amazing on the surface, these third-party font files often take a longer time to load and can contribute to your render-blocking resources problem.
Because of the external files, the browser has to make external requests to download these files to render your page, which may result in significantly higher download times.
If you’re on a team that has less-than-ideal development best practices, then it could stand to reason that you have many third-party font files that are not necessary for rendering your site.
In this case, removing all these unnecessary files can improve your render-blocking resources significantly and contribute to your overall improvement in Core Web Vitals.
Using system fonts, on the other hand, only keeps the processing within the browser without external requests.
Also, there are likely system fonts that may be very similar to the third-party fonts you use.
However, if you absolutely must use third-party fonts, there are two things you want to do to help mitigate issues with certain aspects of third-party fonts.
First, if they are used in conjunction with preload and font-swap, the issues with third-party fonts become a non-issue.
The other issue when using third-party fonts is that fonts are invisible until the font itself loads, which negatively impacts Core Web Vitals and the user experience. To avoid this, you can use font-swap CSS.
Here’s how it works: The font-swap CSS explains to the browser that text which is using a particular font must be displayed immediately using a system font. Once the custom font is ready, this custom font will then replace the system font. This is the most effective method you can use to avoid invisible fonts during page load.
As of 2020, variable fonts have become widely supported in most browsers. What exactly are variable fonts?
With variable fonts, all of your font styles are contained in a single file. But before variable fonts became commonplace, you would need several separate font files for fonts.
There are also several benefits to using variable fonts, which include:
The following documentation talks about variable fonts and how to implement them. Because of their benefits, using variable fonts is an acceptable alternative if you absolutely must implement third-party fonts.
If you’re working with code yourself, you may (or may not … no one is judging here) find that techniques are less than optimal.
One example: You are using inline CSS everywhere, and this is causing processing and rendering glitches within the browser.
The easy solution is to make sure that you take all of the inline CSS and code them properly within the CSS stylesheet file.
If another developer’s code is not up to par, this can create major issues with page rendering.
For example: Say that you have a page that’s coded using older techniques rather than modern and leaner ones.
Older techniques could include significant code bloat and result in the slower rendering of the page as a result.
To eliminate this, you can improve your coding techniques by creating leaner and less bloated code, resulting in a much better page rendering experience.
For example: If you have eight or 10 JavaScript files that all contribute to the same task, you can hire a developer who can combine all of these files for you.
And if they are less critical JavaScript files, then to further decrease the page rendering problems, these files can also be deferred by adding them to the end of the HTML code on the page.
By combining files and improving your coding techniques, you can contribute significantly to better page rendering experiences.
If you want to create your own process to find and reduce render-blocking resources, you now have the tools to do so. The process is outlined as follows:
The idea is to create a process that is easily scalable, easily implemented, and can put you on the path to success with a much smaller page speed as a result.
With this process, you, too, can benefit from the advantage that you will have, and you could also experience a boost from Google’s Core Web Vitals.
Identifying and repairing render-blocking resources is a critical part of speed optimization that most audits feature this step. The reasoning behind this is that they help create the best possible rendering times for your ranking pages.
Google is working on making improvements to page speed all the time. But there is one thing that has always been consistent: the faster your page speed, the better.
By integrating a scalable process where you can accomplish this quickly, it’s possible to tackle even the largest and most complex of page speed optimization projects relatively easily.
And this also translates to a better user experience.
By finding and repairing render-blocking resources, you can also improve how your user experiences your site, and you will continue to keep your website visitors happy.
After all, keeping your site in top shape for prime time is what all of this optimization work is all about!
More Resources:
Featured Image: SuperOhMo/Shutterstock
Brian has been doing SEO since before it was called SEO, back in the days of 1998. Back then, SEO …
Get our daily newsletter from SEJ’s Founder Loren Baker about the latest news in the industry!
Subscribe to our daily newsletter to get the latest industry news.
source
—
Note that any programming tips and code writing requires some knowledge of computer programming. Please, be careful if you do not know what you are doing…